the kepler

store network

TOOLKIT


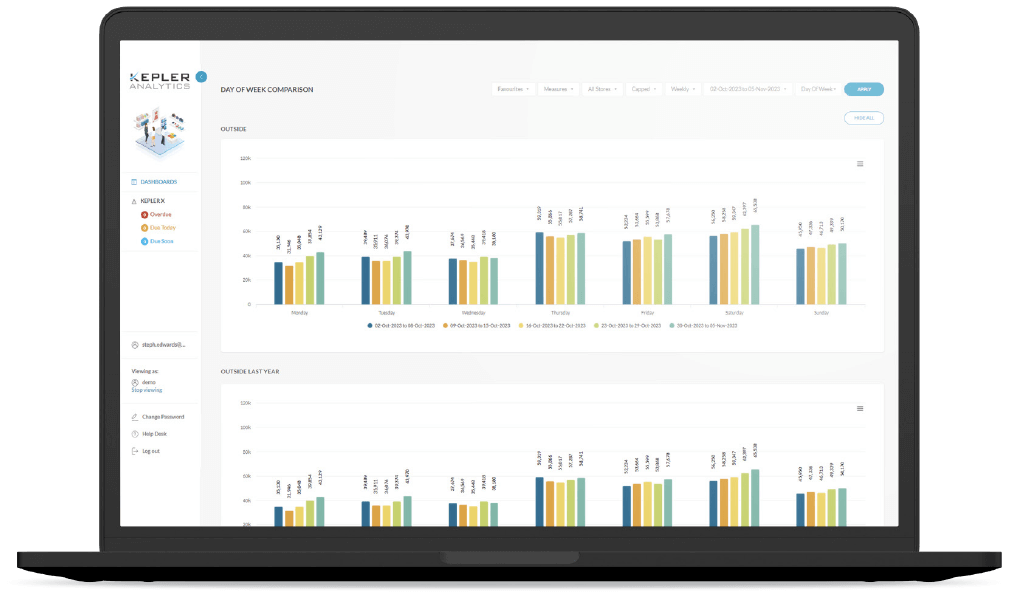
The Kepler Store Network Toolkit uses Kepler passers-by traffic data to help Retail Property Managers maximise store network profitability and expansion success. Data from more than 14,000 Kepler sensors in Australia and New Zealand is engaged to provide you with unprecedented property benchmarking and forecasting tools.

This revolutionary toolkit from Kepler Analytics provides you with a comprehensive overview of every property in your network of stores, with invaluable insights that inform positive business decisions.

Landlords charge for space of, and sales delivered by the store, effectively penalising the retailer for success. The paradigm shift where retailers pay for high volumes of relevant and engaged traffic would provide a more efficient store network.

Retailers also know store fronts and relative positions of doorways and physical structures combine to alter the effectiveness of the store to attract passing traffic into the store. Historically this has been difficult to quantify.

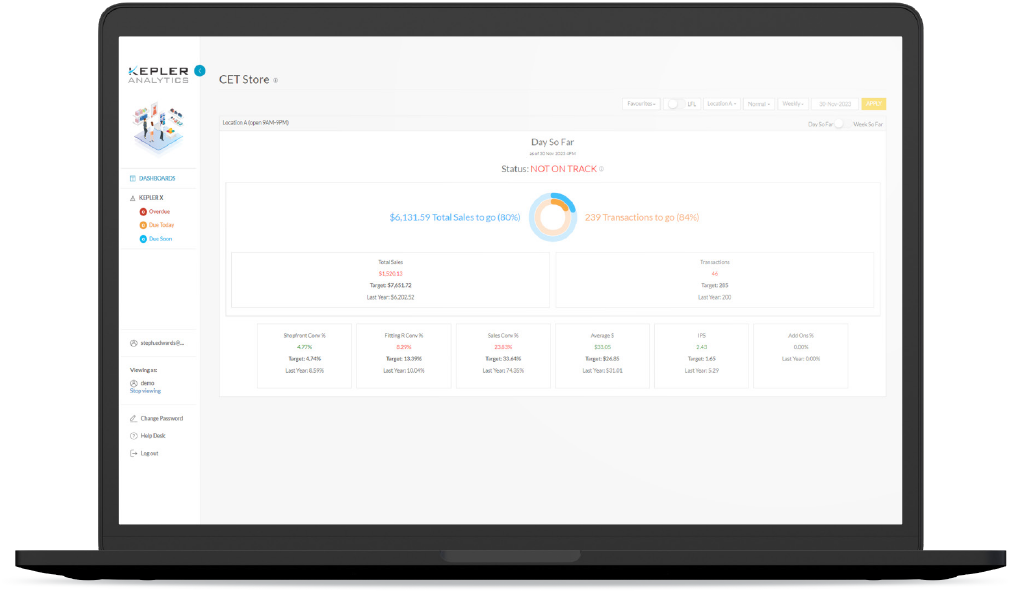
Occupancy costs frequently misalign with the volume of traffic, and often impact store profitability.

Gain Passers-by Traffic Benchmarks

  • Benchmark how much rent you’re paying per passer-by across your network for powerful rent negotiations

  • Benchmark your stores vs other stores in the same centre

  • Use centre traffic and sales trends to assess long term location viability

Assess New Potential Sites and Forecast Sales Before You Begin

  • Forecast store sales at potential new sites using data captured via the Kepler sensor network
  • Assess other sites in the same centre for a potential store move
  • Rank potential sites against your existing store network

When selecting a new site, information sets require the retailer to use landlord data. This may be more specific to a centre as a whole, rather than any specific location.

The information sets we use do not always contain long term independent trends. Benchmarking a specific location against wider centre trends often highlights significant variances.

Mistakes are very costly. This cost is borne by the retailer.

USE CASE 1 BENCHMARK YOUR CENTRES AND LOCATIONS

Client Situation

Our client’s store is situated in a suburban NSW centre that had a major department store as the key tenancy. This department store left the centre at very short notice, and was replaced with a number of major big-box retailers, with existing large networks of stores both in and out of key shopping centres.

Client Question

Our client’s retail tenancy was under review. Should the store continue in its current location and under the same terms?

Results

By comparing the specific location’s Outside Traffic results vs the Outside Traffic for all Kepler locations scattered throughout the centre, it was clear that whilst the centre was performing strongly, and the new big-box retailers had more than replaced the traffic of the old department store, our client’s specific location had lost significant volumes of Outside Traffic.

Recommendation

Our client’s location should not be continued under the same terms. Significant rental abatement, or a better location are required.

USE CASE 2 Assess New Sites within an existing centre

Client Situation

Our client’s was offered a number of locations in an existing suburban centre that they had sought to enter for some time. The locations and sizes varied dramatically. One could be dismissed immediately as too small. Centre level data, and subjective store visits could not sufficiently quantify the prospects of the other stores.

Client Question

Of the three remaining sites, which one offers the best Passing Traffic, and customer behaviour for our client?

Results

By comparing traffic in a variety of locations in the centre from existing Kepler locations, a traffic pattern was developed. The overlay of client-specific customer behaviour from similar profile stores enabled the creation of a traffic, sales, and likely profit model for each location.

Recommendation

Tenancy 100157 offers the best customer behaviour, driving up sales and profit. Whilst 1000003 and 100027 offer more Passing Traffic, customer behaviour in these locations does not align to maximised sales.

HOW MUCH IS

DATA DRIVEN
STORE OPERATIONS

WORTH TO YOUR BUSINESS?

We will provide you with a custom assessment:

  • Custom Assessment for 6 stores in your store network
  • Comprehensive conversion benchmarking
  • Customer-to-staff ratios

Book your

free demo

Simply fill in your details below and we will be in touch to arrange your free custom assessment and comprehensive demo.

    Book your FREE Demo...​

    Simply fill in your details below and we will be in touch to arrange your free custom assessment and comprehensive demo…

    Book your FREE Demo...

    Simply fill in your details below and we will be in touch to arrange your free custom assessment and comprehensive demo.