February 22, 2021

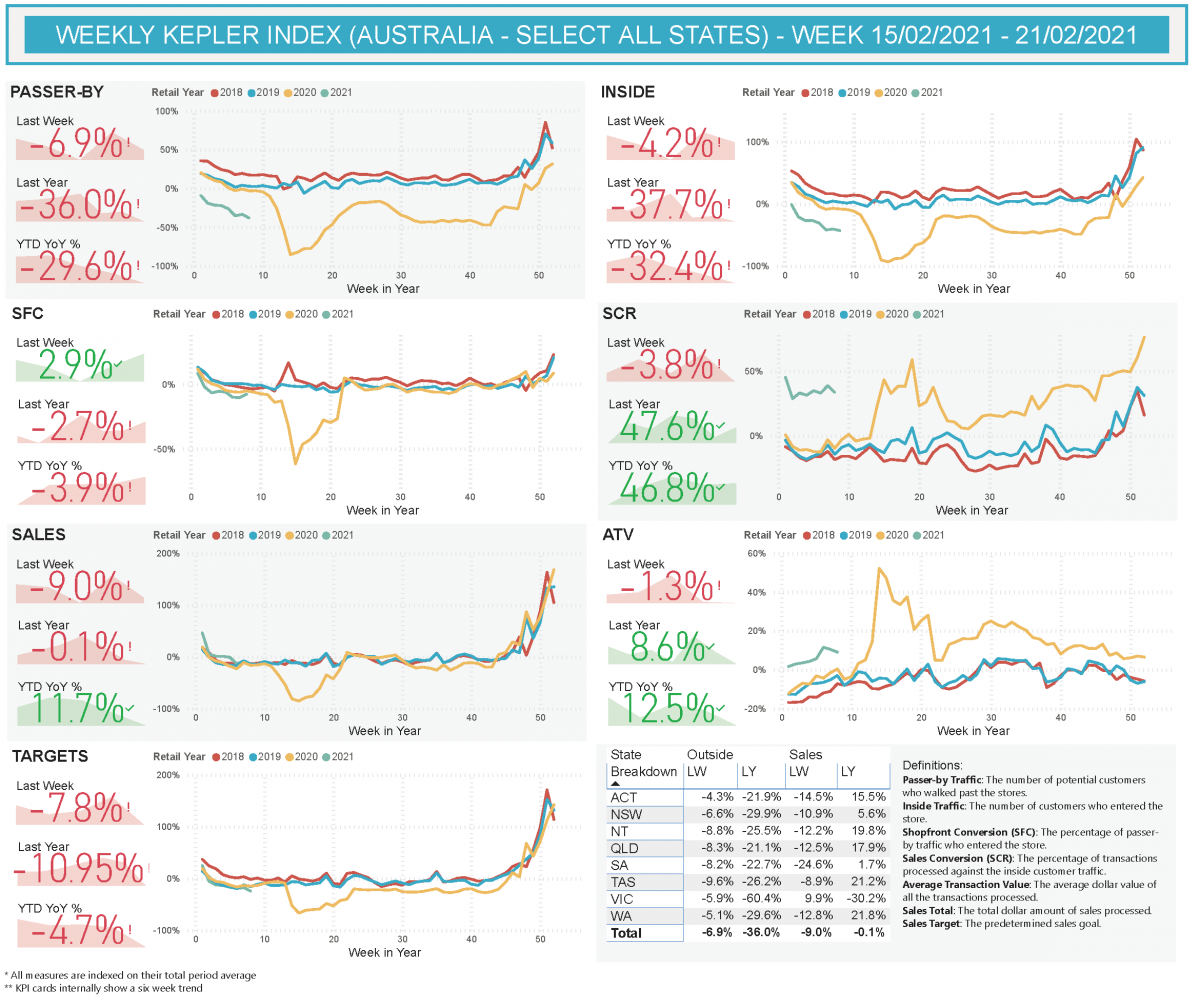
KEPLER RETAIL INDEX (KRI) week ending 21/02/2021 Worldwide pandemic, a blip on the bricks-and-mortar retail sales radar

Uncategorised

There seems to be an innate human behaviour to be outside, socialise and to be more specific shop in brick-and-mortar retail. According to NAB Online Retail Sales Index: December 2020 in the 12 months to December, Australians spent $44.18 billion on online retail, a level that is around 12.6% of the total retail trade estimate.

The graph below, shows brick-and-mortar store sales as a % of total retail sector (including grocery, liquor, takeaway, homewares, appliances, department stores, personal and recreational, and fashion). We can see that during the first lockdown throughout June that brick-and-mortar sales dropped to approximately 90%. We can see a similar drop in November which accounts for the Victorian lock down, but again we can see the recovery through December and January.

All this data shows that, even going through a world-wide pandemic, brick-and-mortar retail still produces approximately 90% of retail sales. This is not to say online isn’t important, its to say brick-and-mortar is not going anywhere anytime soon.

Kepler Analytics InFocus webinars
This coming Thursday and Friday we will be hosting we will be introducing a new series of webinars called Kepler Analytics InFocus. These webinars will showcase some of our most popular dashboards, what their function is and how to take full advantage of them to ultimately help you with sales optimisation.

They will run for approx 30-45 mins and the first will take place this Thursday 25th February at 8:30am. Even if you are a proficient user of our dashboards, these webinars are designed to show real world applications, examples, shortcuts and tips that you may not have seen or used before. If you would like to join these sessions, please use the links below.

Click on the image to enlarge

Webinar:
Thu 25/02  8:30am  AEDT
Learn about:
Groups +
User Admins

Webinar:
Fri 26/02  8:30am  AEDT
Learn about:
User Audit Dashboard
+ Like for Like (LFL)

If you would like to see the full capability of our KRI, register below for a FREE Demo.

related articles

Uncategorised

Timing and behaviours of traffic and purchasing has altered from pre-COVID-19 patterns

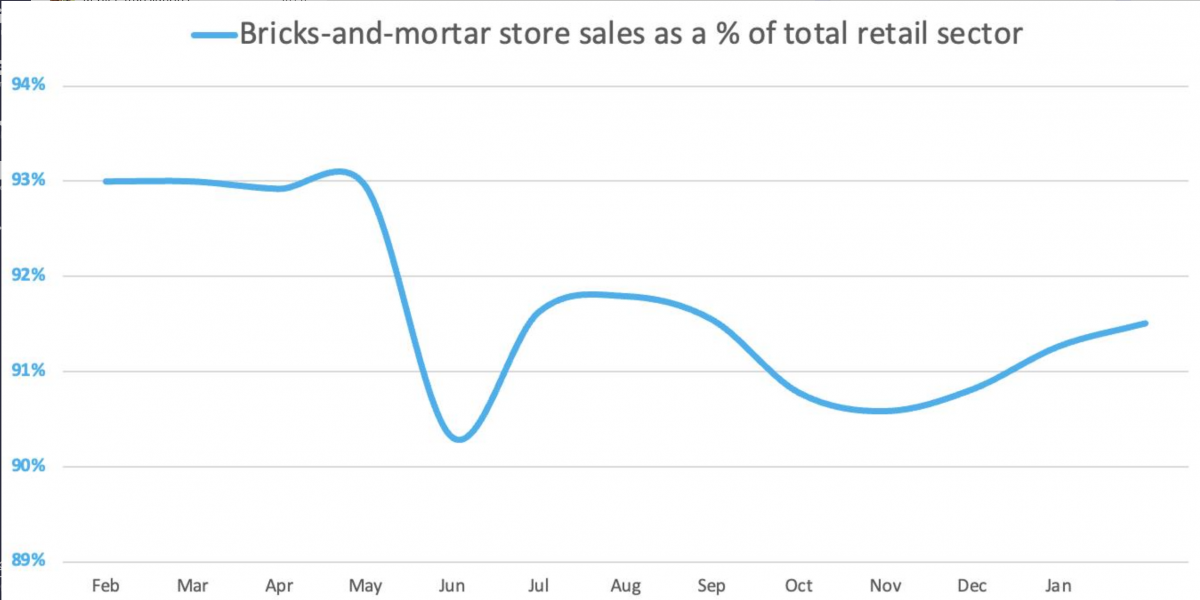
Kepler has reviewed the first five months of...

READ MORE

August 1, 2022

Uncategorised

How To Increase Profits In Retail

Whether we’re talking about a small chain of...

READ MORE

July 13, 2022

Uncategorised

How To Increase Sales In Retail

Any business owner or marketer worth their salt...

READ MORE

July 13, 2022

Uncategorised

How To Measure Foot Traffic

Foot traffic is one of the most important...

READ MORE

July 13, 2022

There seems to be an innate human behaviour to be outside, socialise and to be more specific shop in brick-and-mortar retail. According to NAB Online Retail Sales Index: December 2020 in the 12 months to December, Australians spent $44.18 billion on online retail, a level that is around 12.6% of the total retail trade estimate.

The graph below, shows brick-and-mortar store sales as a % of total retail sector (including grocery, liquor, takeaway, homewares, appliances, department stores, personal and recreational, and fashion). We can see that during the first lockdown throughout June that brick-and-mortar sales dropped to approximately 90%. We can see a similar drop in November which accounts for the Victorian lock down, but again we can see the recovery through December and January.

All this data shows that, even going through a world-wide pandemic, brick-and-mortar retail still produces approximately 90% of retail sales. This is not to say online isn’t important, its to say brick-and-mortar is not going anywhere anytime soon.

Kepler Analytics InFocus webinars
This coming Thursday and Friday we will be hosting we will be introducing a new series of webinars called Kepler Analytics InFocus. These webinars will showcase some of our most popular dashboards, what their function is and how to take full advantage of them to ultimately help you with sales optimisation.

They will run for approx 30-45 mins and the first will take place this Thursday 25th February at 8:30am. Even if you are a proficient user of our dashboards, these webinars are designed to show real world applications, examples, shortcuts and tips that you may not have seen or used before. If you would like to join these sessions, please use the links below.

Click on the image to enlarge

Webinar:
Thu 25/02  8:30am  AEDT
Learn about:
Groups +
User Admins

Webinar:
Fri 26/02  8:30am  AEDT
Learn about:
User Audit Dashboard
+ Like for Like (LFL)

If you would like to see the full capability of our KRI, register below for a FREE Demo.

Book your

free demo

Simply fill in your details below and we will be in touch to arrange your free custom assessment and comprehensive demo.

    Book your FREE Demo...​

    Simply fill in your details below and we will be in touch to arrange your free custom assessment and comprehensive demo…

    Book your FREE Demo...

    Simply fill in your details below and we will be in touch to arrange your free custom assessment and comprehensive demo.