October 14, 2019
Retail Radar – The Shadow of Christmas Past
Uncategorised
October 14, 2019
Uncategorised

Kepler Analytics is in a unique and privileged position. We have our sensors in over 3000 locations globally, collecting traffic and other consumer behaviour data anonymously. Our clients provide us with their daily sales targets, actual POS sales and other specific data points on which they measure and manage their businesses. By aggregating and anonymising this information, we can provide unique insights into the Retail Industry as a whole, benchmarking measures on traffic, sales, conversion, and other associated KPIs to help retailers better understand consumer behaviour and drivers behind retail sales. The Kepler Retail Radar (KRR) is published every 6-8 weeks and aims to share what we’ve learned from our network of Retailers and deliver helpful insights which assist in understanding historical performance, but also highlight opportunities for better results in the future.
Executive Summary
The shadow of two very challenging Christmas sales periods looms large over the upcoming peak trading period for 2019. The need to get the Christmas expectation, and supporting activity correct is more imperative than ever. Using the Kepler Retail Index, we have reviewed the traffic patterns, purchasing behaviours, and business behaviours of the last two years on a daily basis.
Our analysis starts from the Wednesday immediately following Melbourne Cup Day (Wednesday 8th November, 2017, and Wednesday 7th November 2018) and compares each day of the week against each other. We will see below that centre traffic levels remain challenging, and that customers are more aware of the “bargain discount” opportunities presented by Black Friday and Boxing Day. These events, in particular Black Friday, have changed the layout of the Christmas campaign, and seem to compress the 3 weeks of December into two periods of 3-4 days each, at either end of the campaign.
However, despite the many challenges and unforgiving nature of the peak period, Retailers have responded well. Opportunities remain for retailers willing to move now to increase traffic flow into store, and drive the capability for stores to increase ATV. The prize is, as it always is at this time of year, significant. The opportunity is clear, and those retailers that have taken the solutions offered by Kepler have a clear path forward to be able to monitor progress to success, and more importantly make adjustments when needed.
Traffic Patterns – Is Anyone Out There?
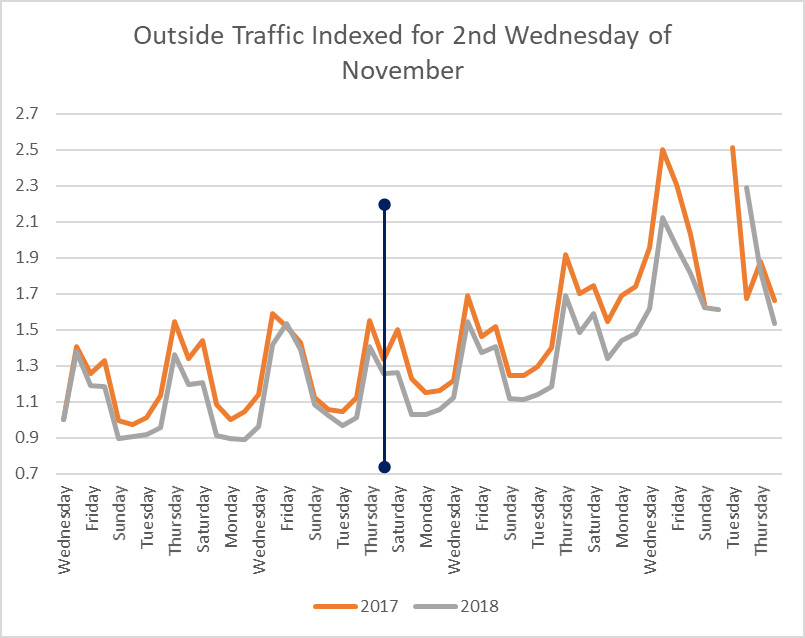
Outside traffic patterns followed a similar pattern in 2018 vs 2017, though with a notable decline. Where traffic peaked circa 2.5x the rate of the index beginning in 2017, with the peak pre-Christmas, 2018 showed a distinct reduction, peaking at circa 2.3x magnitude, and after Christmas.
Purchase Patterns & Behaviours – Reward for Effort
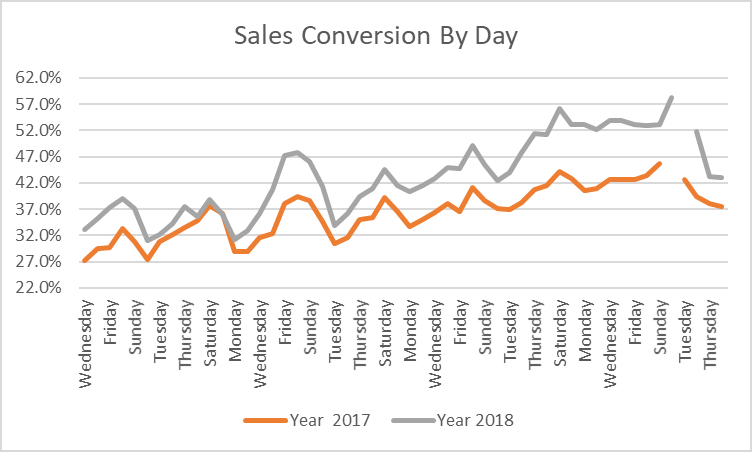
So with a reduced pool of potential and actual traffic to stores, how are the stores themselves coping at delivering sales? Sales Conversion % showed strong results in 2018 versus the prior year. Not only were results vastly improved, but the rate of improvement was dramatic.
The gap increased from +~3% to +~10% over the course of the period. This is very consistent with Kepler’s findings that although traffic is down, those that visit a store have a stronger inclination to purchase! Fewer browsers and more shoppers!
Items per Sale in 2018 showed an increase on Prior Year also, though the rate of increase declined or was sporadic certainly after Black Friday. Whilst results were positive, and this cannot be underplayed, when this metric is coupled with the ATV trend shown below, the results are mixed. More people buying more items at lower price points.
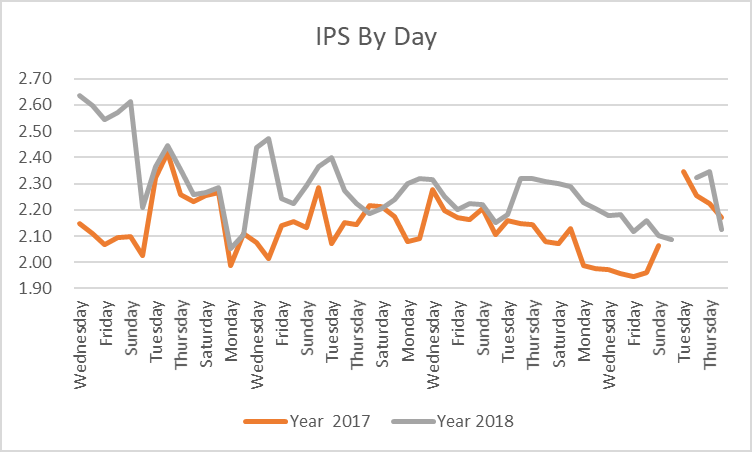
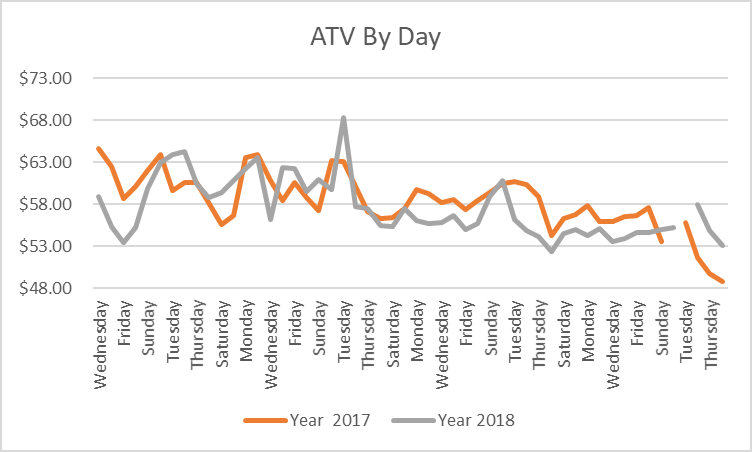
These graphs show the challenge posed by, and response of retailers, to the
general decline in traffic: Sell harder, sell more things, but at a reduced price. Whilst we cannot uncover whether the reduced prices are coming at a cost of reduced margin, there may be room for the savvy retailer to take up the challenge of ATV as we move into 2019 peak trading period.
This poses an opportunity for retailers to execute the sales event earlier to capitalise on the spike in traffic we can expect in 2019.
Given that the traffic is higher than the first weekend of December, this is a key window to explore.
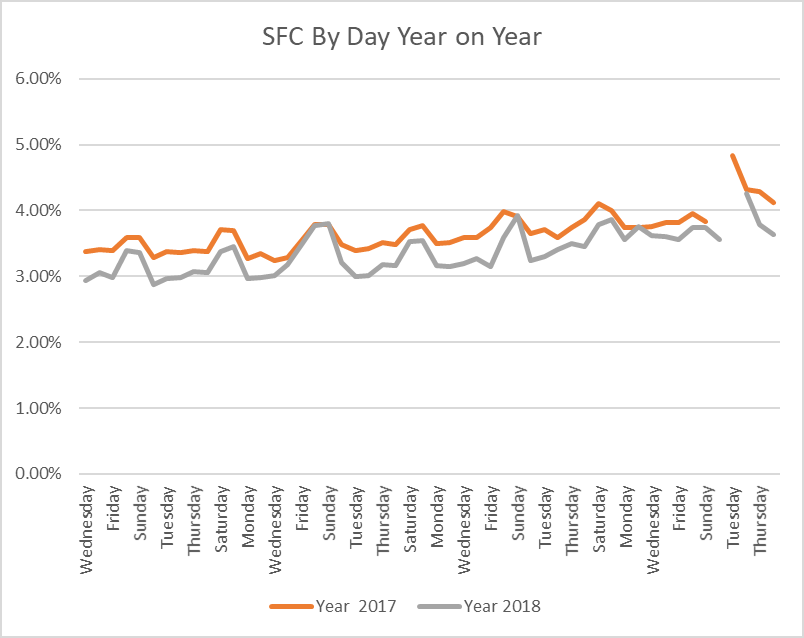
Even with declining traffic in centres, customers entered fewer stores. Shopfront Conversion in 2018 only matched 2017 results once – Black Friday Weekend. Over the remainder of the key trading period, this critical measure continued to decline vs year prior. Interestingly, the rate of decline did reduce dramatically the closer consumers were to Christmas itself.
Again, the traffic pattern for 2018 followed an almost identical peak-and-trough pattern to 2017. The notable exception is again Black Friday weekend where the solidity of the Shopfront Conversion helped stores achieve a higher indexed customer entry level. Shopfront Conversion remains a key driver for Australian retailers.
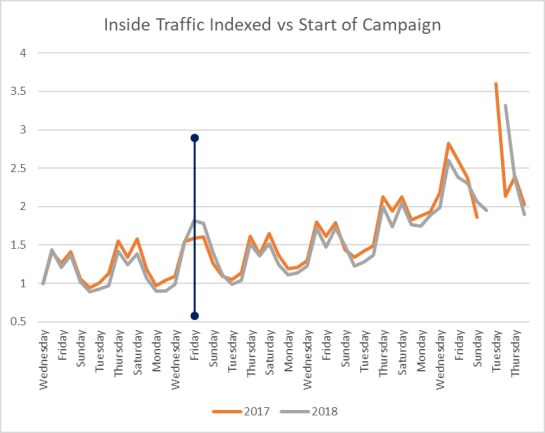
Whilst there may be an acceptance of reduced traffic in centres by everyone (excluding landlords, of course), the results on Black Friday weekend show the customer is not entirely fickle and gone from Bricks and Mortar channels. Retailers that are able to leverage customer research online into store visits will reap the rewards.
The Final Washup
Most retailers reduced their sales targets marginally in 2018. Certainly in December, expectations for sales were lower than they were in November. Interestingly, retailers expected less from Boxing Day sales as well, which in 2017 were for many retailers, the saving-grace of the campaign.
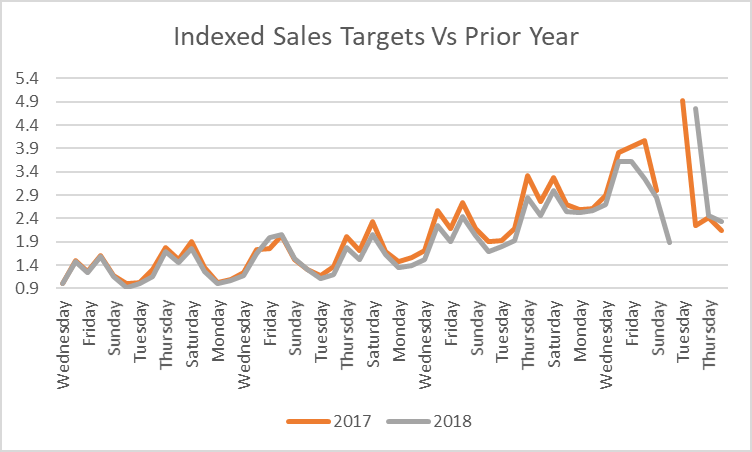
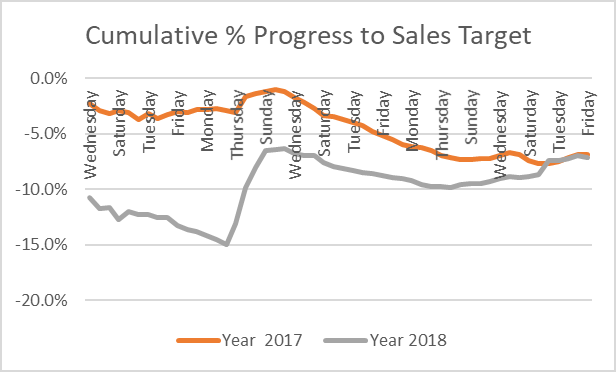
The result of the campaign though was very different. November started very poorly against budget in 2018. Sales Targets had not materially increased, however the sales did not eventuate… right until Black Friday.
This is indicative of the impact of Black Friday taking retailers by surprise last year. That will not be the case in 2019 – if you do not plan and adapt to this significant new retail period – beware!
The spike in sales against target for Black Friday was significant, and almost had stores back on track in both 2017 and 2018. Though it is worth noting the size of the reversal in 2018. As most retailers will attest, the turnaround was short lived and results declined again… this time until Boxing Day. The end result was starkly similar to the prior year, even with a slightly reduced target in 2018.
With Black Friday being a week later this year, the impacts for November and December will be significant. Customer flows in November will normally build up a week later than 2018 but we all realise that retailers are planning to activate promotions during the week before Black Friday (w/c 18 November) this year.

By the same token, December may start stronger, as the Black Friday weekend leeches into December. But retailers must be critically aware of the reduced time frame between Black Friday and Xmas.
A key difference between 2019 and 2018 is that there are only 3 weeks between Black Friday and Xmas this year.
This has two affects:
Conclusion
Kepler has reviewed the first five months of...
August 1, 2022
Whether we’re talking about a small chain of...
July 13, 2022
Any business owner or marketer worth their salt...
July 13, 2022
Foot traffic is one of the most important...
July 13, 2022
Kepler Analytics is in a unique and privileged position. We have our sensors in over 3000 locations globally, collecting traffic and other consumer behaviour data anonymously. Our clients provide us with their daily sales targets, actual POS sales and other specific data points on which they measure and manage their businesses. By aggregating and anonymising this information, we can provide unique insights into the Retail Industry as a whole, benchmarking measures on traffic, sales, conversion, and other associated KPIs to help retailers better understand consumer behaviour and drivers behind retail sales. The Kepler Retail Radar (KRR) is published every 6-8 weeks and aims to share what we’ve learned from our network of Retailers and deliver helpful insights which assist in understanding historical performance, but also highlight opportunities for better results in the future.
Executive Summary
The shadow of two very challenging Christmas sales periods looms large over the upcoming peak trading period for 2019. The need to get the Christmas expectation, and supporting activity correct is more imperative than ever. Using the Kepler Retail Index, we have reviewed the traffic patterns, purchasing behaviours, and business behaviours of the last two years on a daily basis.
Our analysis starts from the Wednesday immediately following Melbourne Cup Day (Wednesday 8th November, 2017, and Wednesday 7th November 2018) and compares each day of the week against each other. We will see below that centre traffic levels remain challenging, and that customers are more aware of the “bargain discount” opportunities presented by Black Friday and Boxing Day. These events, in particular Black Friday, have changed the layout of the Christmas campaign, and seem to compress the 3 weeks of December into two periods of 3-4 days each, at either end of the campaign.
However, despite the many challenges and unforgiving nature of the peak period, Retailers have responded well. Opportunities remain for retailers willing to move now to increase traffic flow into store, and drive the capability for stores to increase ATV. The prize is, as it always is at this time of year, significant. The opportunity is clear, and those retailers that have taken the solutions offered by Kepler have a clear path forward to be able to monitor progress to success, and more importantly make adjustments when needed.

Traffic Patterns – Is Anyone Out There?
Outside traffic patterns followed a similar pattern in 2018 vs 2017, though with a notable decline. Where traffic peaked circa 2.5x the rate of the index beginning in 2017, with the peak pre-Christmas, 2018 showed a distinct reduction, peaking at circa 2.3x magnitude, and after Christmas.
Purchase Patterns & Behaviours – Reward for Effort

So with a reduced pool of potential and actual traffic to stores, how are the stores themselves coping at delivering sales? Sales Conversion % showed strong results in 2018 versus the prior year. Not only were results vastly improved, but the rate of improvement was dramatic.
The gap increased from +~3% to +~10% over the course of the period. This is very consistent with Kepler’s findings that although traffic is down, those that visit a store have a stronger inclination to purchase! Fewer browsers and more shoppers!
Items per Sale in 2018 showed an increase on Prior Year also, though the rate of increase declined or was sporadic certainly after Black Friday. Whilst results were positive, and this cannot be underplayed, when this metric is coupled with the ATV trend shown below, the results are mixed. More people buying more items at lower price points.


These graphs show the challenge posed by, and response of retailers, to the
general decline in traffic: Sell harder, sell more things, but at a reduced price. Whilst we cannot uncover whether the reduced prices are coming at a cost of reduced margin, there may be room for the savvy retailer to take up the challenge of ATV as we move into 2019 peak trading period.
This poses an opportunity for retailers to execute the sales event earlier to capitalise on the spike in traffic we can expect in 2019.
Given that the traffic is higher than the first weekend of December, this is a key window to explore.

Even with declining traffic in centres, customers entered fewer stores. Shopfront Conversion in 2018 only matched 2017 results once – Black Friday Weekend. Over the remainder of the key trading period, this critical measure continued to decline vs year prior. Interestingly, the rate of decline did reduce dramatically the closer consumers were to Christmas itself.
Again, the traffic pattern for 2018 followed an almost identical peak-and-trough pattern to 2017. The notable exception is again Black Friday weekend where the solidity of the Shopfront Conversion helped stores achieve a higher indexed customer entry level. Shopfront Conversion remains a key driver for Australian retailers.

Whilst there may be an acceptance of reduced traffic in centres by everyone (excluding landlords, of course), the results on Black Friday weekend show the customer is not entirely fickle and gone from Bricks and Mortar channels. Retailers that are able to leverage customer research online into store visits will reap the rewards.
The Final Washup
Most retailers reduced their sales targets marginally in 2018. Certainly in December, expectations for sales were lower than they were in November. Interestingly, retailers expected less from Boxing Day sales as well, which in 2017 were for many retailers, the saving-grace of the campaign.


The result of the campaign though was very different. November started very poorly against budget in 2018. Sales Targets had not materially increased, however the sales did not eventuate… right until Black Friday.
This is indicative of the impact of Black Friday taking retailers by surprise last year. That will not be the case in 2019 – if you do not plan and adapt to this significant new retail period – beware!
The spike in sales against target for Black Friday was significant, and almost had stores back on track in both 2017 and 2018. Though it is worth noting the size of the reversal in 2018. As most retailers will attest, the turnaround was short lived and results declined again… this time until Boxing Day. The end result was starkly similar to the prior year, even with a slightly reduced target in 2018.
With Black Friday being a week later this year, the impacts for November and December will be significant. Customer flows in November will normally build up a week later than 2018 but we all realise that retailers are planning to activate promotions during the week before Black Friday (w/c 18 November) this year.

By the same token, December may start stronger, as the Black Friday weekend leeches into December. But retailers must be critically aware of the reduced time frame between Black Friday and Xmas.
A key difference between 2019 and 2018 is that there are only 3 weeks between Black Friday and Xmas this year.
This has two affects:
Conclusion

Simply fill in your details below and we will be in touch to arrange your free custom assessment and comprehensive demo.
Simply fill in your details below and we will be in touch to arrange your free custom assessment and comprehensive demo…
Simply fill in your details below and we will be in touch to arrange your free custom assessment and comprehensive demo.