November 5, 2020
Black Friday 2020 Preview | Kepler Retail Radar
Uncategorised
November 5, 2020
Uncategorised

Although shopping behaviours have changed in 2020, Kepler believes there are still fundamental trends which retailers need to take into account.
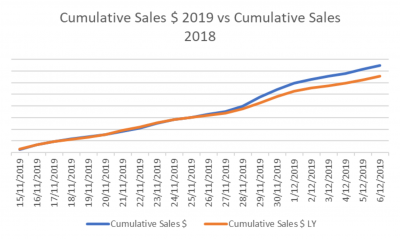
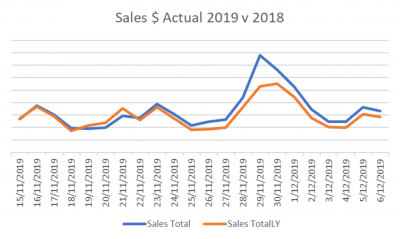
The Black Friday retail sales result from 2019 was generally very positive. On a Like for Like basis over 21 days (14 up to and including Black Friday, 7 days following), retailers showed a 14% increase on prior year Sales $ – a rare event in 2019, to say the least!
There were two key standouts:
It is not difficult to predict that this year the Black Friday weekend will be a bonanza! But there are significant dangers to performance and these relate to three core areas:
All three areas need to be thought through and addressed. The following provides a window into last year and we hope you enjoy the insights and learning for this year.
Happy trading.
The Black Friday retail sales result from 2019 was generally very positive. On a Like for Like basis over 21 days (14 up to and including Black Friday, 7 days following), retailers showed a 14% increase on prior year Sales $ – a rare event in 2019, to say the least!
There were two key standouts:
The suggestion this year, is that we again believe there is growth in the leadup to Black Friday – maximising the length of the offer (assuming stock intregrity) prior to the event will reap rewards.
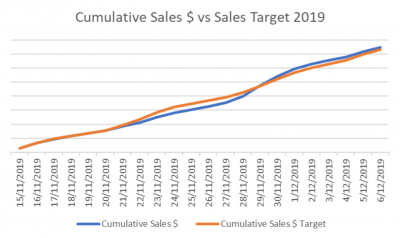
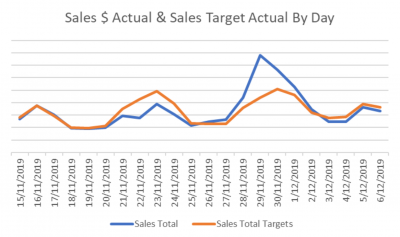
We also suggest that targets are aligned to the new timing of Black Friday for 2020.
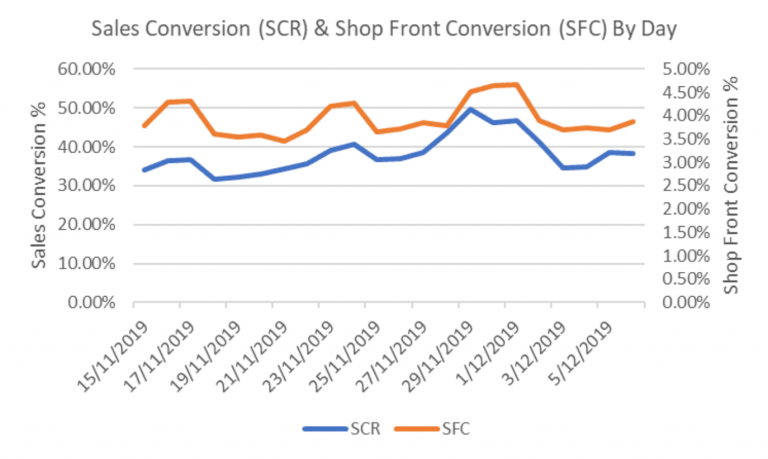
Sales Conversion (defined as the number of transactions divided by total Inside Traffic) for the period showed very healthy results and a discernible upwards trend over the period.
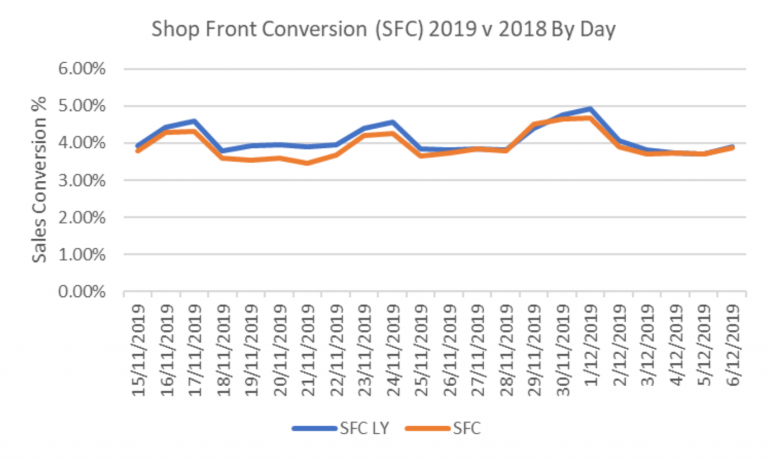
Similarly Shop Front Conversion (defined as the proportion of Outside or Passing Traffic that then entered the retail store fore 30 seconds or more) similarly rose. This rise in Shop front Conversion is vital for two key reasons:
Post Covid lockdowns, we expect these results to continue to shape in positive fashion for Black Friday 2020

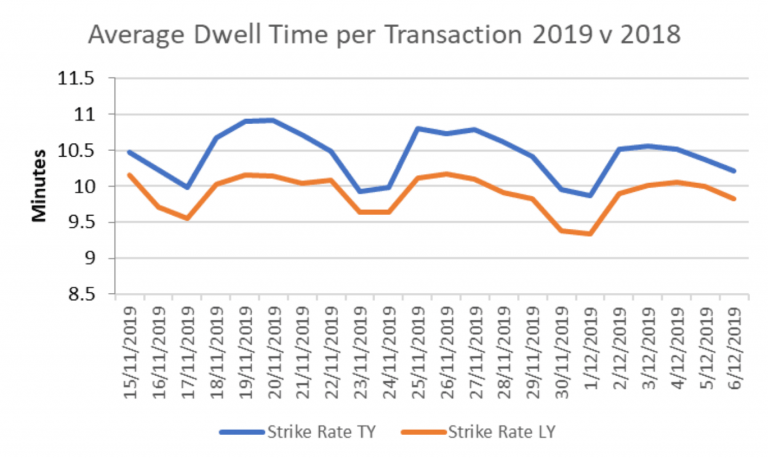
We have analysed a metric we call “Strike Rate” – that is, the amount of time spent inside your store by all transaction possible Inside Traffic (with an accurate staff exclusion) per transaction. So for example, if we had 2 people inside for 5 minutes each that resulted in 1 transaction, this would give a Strike Rate of 10 Minutes ( and yes, we proudly accept that there may be some Cricket statistic nerds amongst our staff).
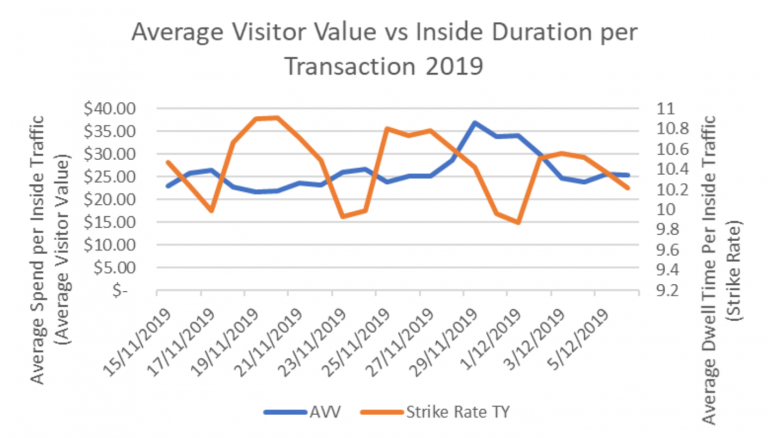
We also like to add colour to ATV metrics, and define our Average Visitor Value – the $ spend per Inside Traffic, as a measure of total store engagement to encourage the primary or even additional purchase.
Again, there were two key highlights:
It is worth noting that this is pre-Covid. We have seen the Dwell Time barrier increase over 2020 year to date. With traffic restrictions and capacity limits, service models must be sharp, on point, well engaged and well versed in completing transactions. To make customers dwell in store will cause additional lost revenue in 2020.
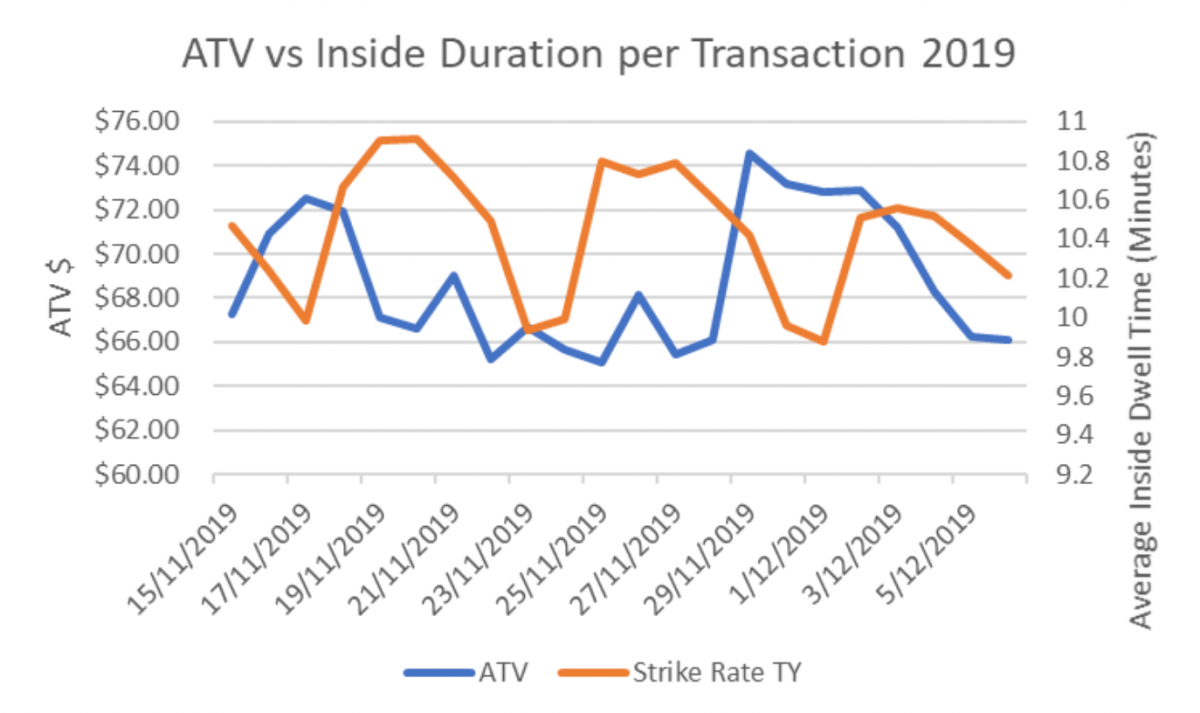
We expect that 2020 will deliver less traffic into stores. The population is wary of crowds. And retailers may have capacity and space limits to deal with.
Our suggestions are this:
Kepler has reviewed the first five months of...
August 1, 2022
Whether we’re talking about a small chain of...
July 13, 2022
Any business owner or marketer worth their salt...
July 13, 2022
Foot traffic is one of the most important...
July 13, 2022
Although shopping behaviours have changed in 2020, Kepler believes there are still fundamental trends which retailers need to take into account.
The Black Friday retail sales result from 2019 was generally very positive. On a Like for Like basis over 21 days (14 up to and including Black Friday, 7 days following), retailers showed a 14% increase on prior year Sales $ – a rare event in 2019, to say the least!
There were two key standouts:
It is not difficult to predict that this year the Black Friday weekend will be a bonanza! But there are significant dangers to performance and these relate to three core areas:
All three areas need to be thought through and addressed. The following provides a window into last year and we hope you enjoy the insights and learning for this year.
Happy trading.
The Black Friday retail sales result from 2019 was generally very positive. On a Like for Like basis over 21 days (14 up to and including Black Friday, 7 days following), retailers showed a 14% increase on prior year Sales $ – a rare event in 2019, to say the least!
There were two key standouts:
The suggestion this year, is that we again believe there is growth in the leadup to Black Friday – maximising the length of the offer (assuming stock intregrity) prior to the event will reap rewards.
We also suggest that targets are aligned to the new timing of Black Friday for 2020.


Sales Conversion (defined as the number of transactions divided by total Inside Traffic) for the period showed very healthy results and a discernible upwards trend over the period.
Similarly Shop Front Conversion (defined as the proportion of Outside or Passing Traffic that then entered the retail store fore 30 seconds or more) similarly rose. This rise in Shop front Conversion is vital for two key reasons:
Post Covid lockdowns, we expect these results to continue to shape in positive fashion for Black Friday 2020


We have analysed a metric we call “Strike Rate” – that is, the amount of time spent inside your store by all transaction possible Inside Traffic (with an accurate staff exclusion) per transaction. So for example, if we had 2 people inside for 5 minutes each that resulted in 1 transaction, this would give a Strike Rate of 10 Minutes ( and yes, we proudly accept that there may be some Cricket statistic nerds amongst our staff).
We also like to add colour to ATV metrics, and define our Average Visitor Value – the $ spend per Inside Traffic, as a measure of total store engagement to encourage the primary or even additional purchase.
Again, there were two key highlights:
It is worth noting that this is pre-Covid. We have seen the Dwell Time barrier increase over 2020 year to date. With traffic restrictions and capacity limits, service models must be sharp, on point, well engaged and well versed in completing transactions. To make customers dwell in store will cause additional lost revenue in 2020.


We expect that 2020 will deliver less traffic into stores. The population is wary of crowds. And retailers may have capacity and space limits to deal with.
Our suggestions are this:

Simply fill in your details below and we will be in touch to arrange your free custom assessment and comprehensive demo.
Simply fill in your details below and we will be in touch to arrange your free custom assessment and comprehensive demo…
Simply fill in your details below and we will be in touch to arrange your free custom assessment and comprehensive demo.